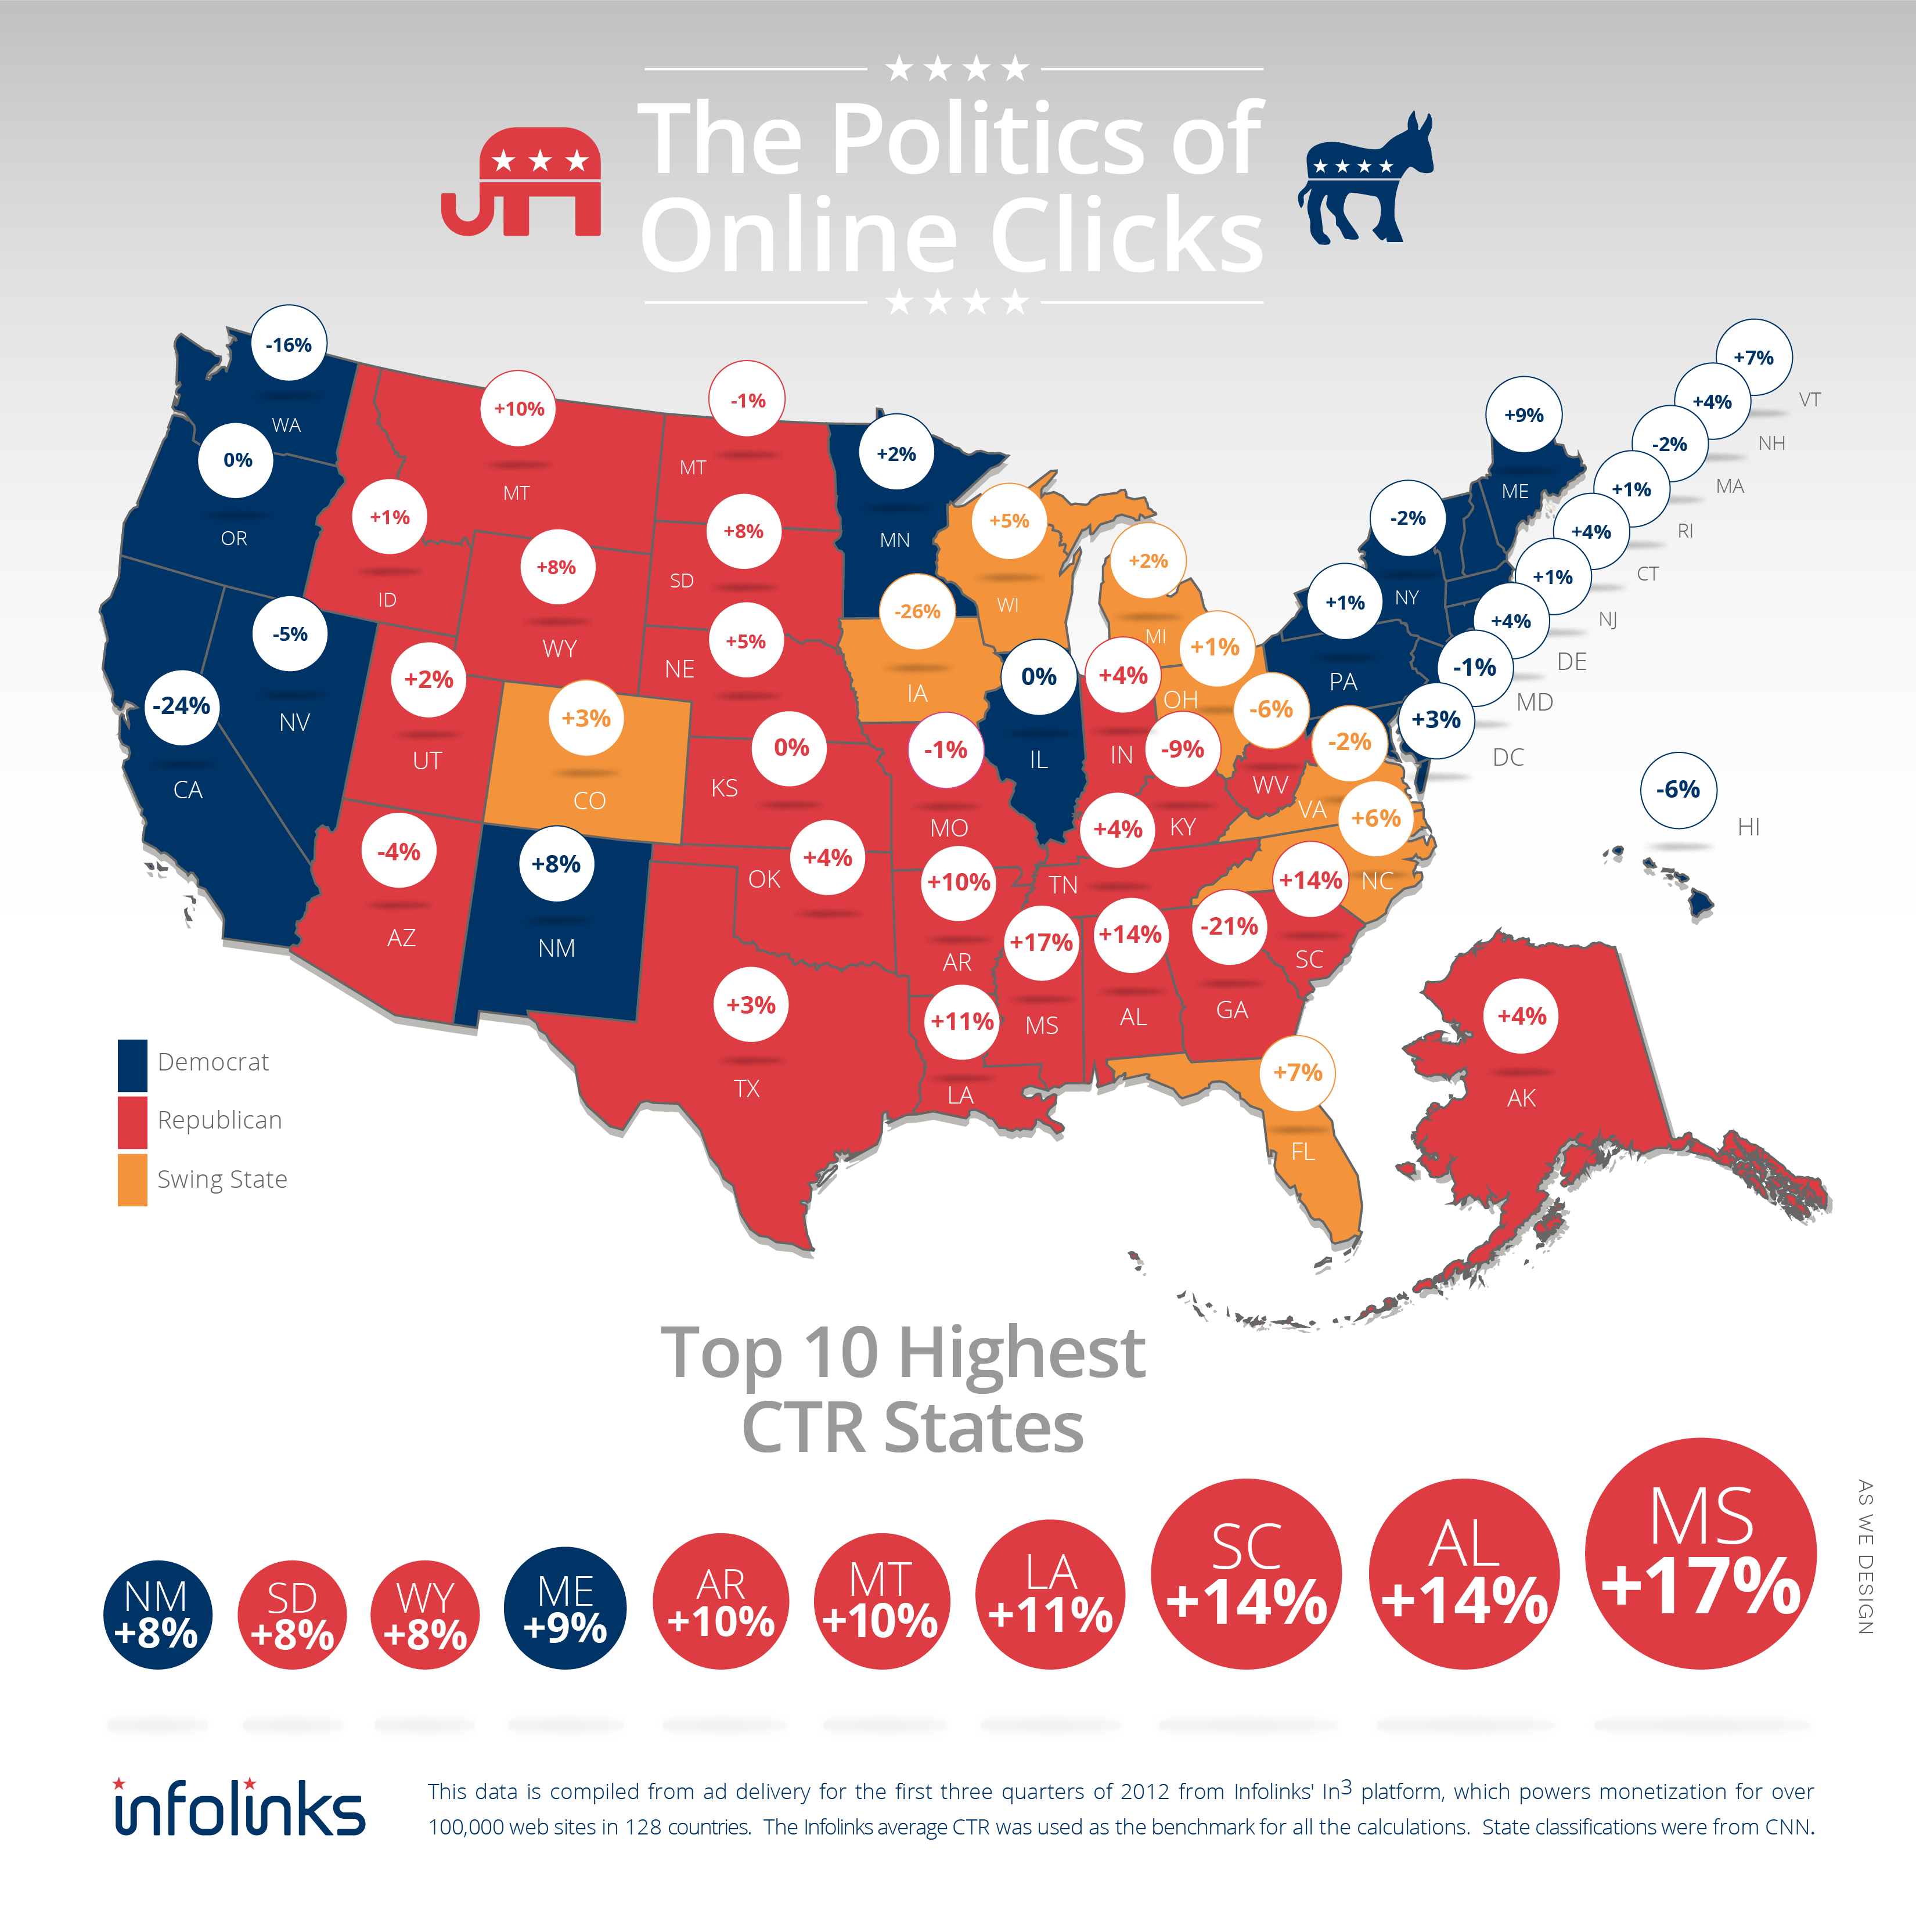
 Infolinks data reveals that states with a predominantly Republican population have a 6% higher CTR than states with a Democratic majority. See the infographic below for state by state results of CTR according to Infolinks network of over 100,000 sites.
Election Day in the United States is right around the corner and the media frenzy is at a fever pitch as pundits, talking heads and campaigners alike are hustling to get their messages out hoping to sway Americans’ decision on November 6th. Barack Obama changed the game in 2008 with his groundbreaking campaign strategy including innovative technology, native advertising and Social Media. Now both Obama and Romney are relying heavily on the internet to reach the White House in 2012.
Infolinks measured the CTR of each state to investigate a possible correlation between the political leaning of states and the average CTR. Click through rate or CTR is a way to measure user engagement with online ads, it quantifies the average amount of times users click on ads. When strategizing any online campaign (especially political), discerning the behavior of voters can assist in understanding which vehicles are most effective in reaching them.
This election is providing interesting statistics for online publishers and advertisers as well. According to Infolinks data from their network of over 100,000 websites which deliver over 1 trillion impressions per month, Republican states average 6% higher CTR overall than states with a predominantly Democrat population over quarters 1 thru 3 of 2012. An overwhelming 75% of the 20 highest CTR states are red. Of the top ten states with the highest CTR rates, eight are Republican and only two Democratic, and the top four CTR states are all located in the Southern part of the United States, including Mississippi, South Carolina, Alabama and Louisiana.
On the opposite side of the spectrum, the 10 states that had the lowest CTR rates were split down the middle, five states to the Republicans and five to the Democrats. These states were equally diverse according to their geographical location.
The statistics found in this study reveal which states are most worthy of an allotted online advertising budget to reach voters who are more prone to click and engage with this format of political strategizing. It may also reveal economic factors to different areas of the country, since some areas are less technologically advanced on account of low economies and would therefore respond better to different advertising media.
See this interesting infographic also on Pando Daily.


